We start with our macro analysis for the weekly time frame. This is where the key components of technical analysis and indicators find their combined path.
These will be compared with WAVES' direct competitors, and it will be determined which asset has the best prospects for high time frames that apply to longer-term holding periods.
WAVES/USDT
(Click the image for higher resolution)
WAVES started the previous month with a powerful candle to the top. This 100%+ candle was a resistance breakthrough that stopped the waves for the better half of 2020. From a technical point of view, the chances for a complete retracement of such euphoric moves are very high and are usually referred to as a setback in technical space. This setback allows the fracture area to be tested again, thus reversing the previous resistance into new support.
The trained technical analyst immediately recognizes the volume deviation of the recent price dumping. This volume divergence shows that this is more of a backtrace and not a newly started downtrend, which confirms the setback theory.
Looking at the technical indicators, we have the MKAST LenLen band and the MKAST index.
Here we can see that the band is just entering the previous resistance range. This confirms once again that this area is of interest and gives it a very high probability of a possible rebound. Furthermore, the MKAST index still shows 11/15 points while always moving above the ALMA.
ATOM/USD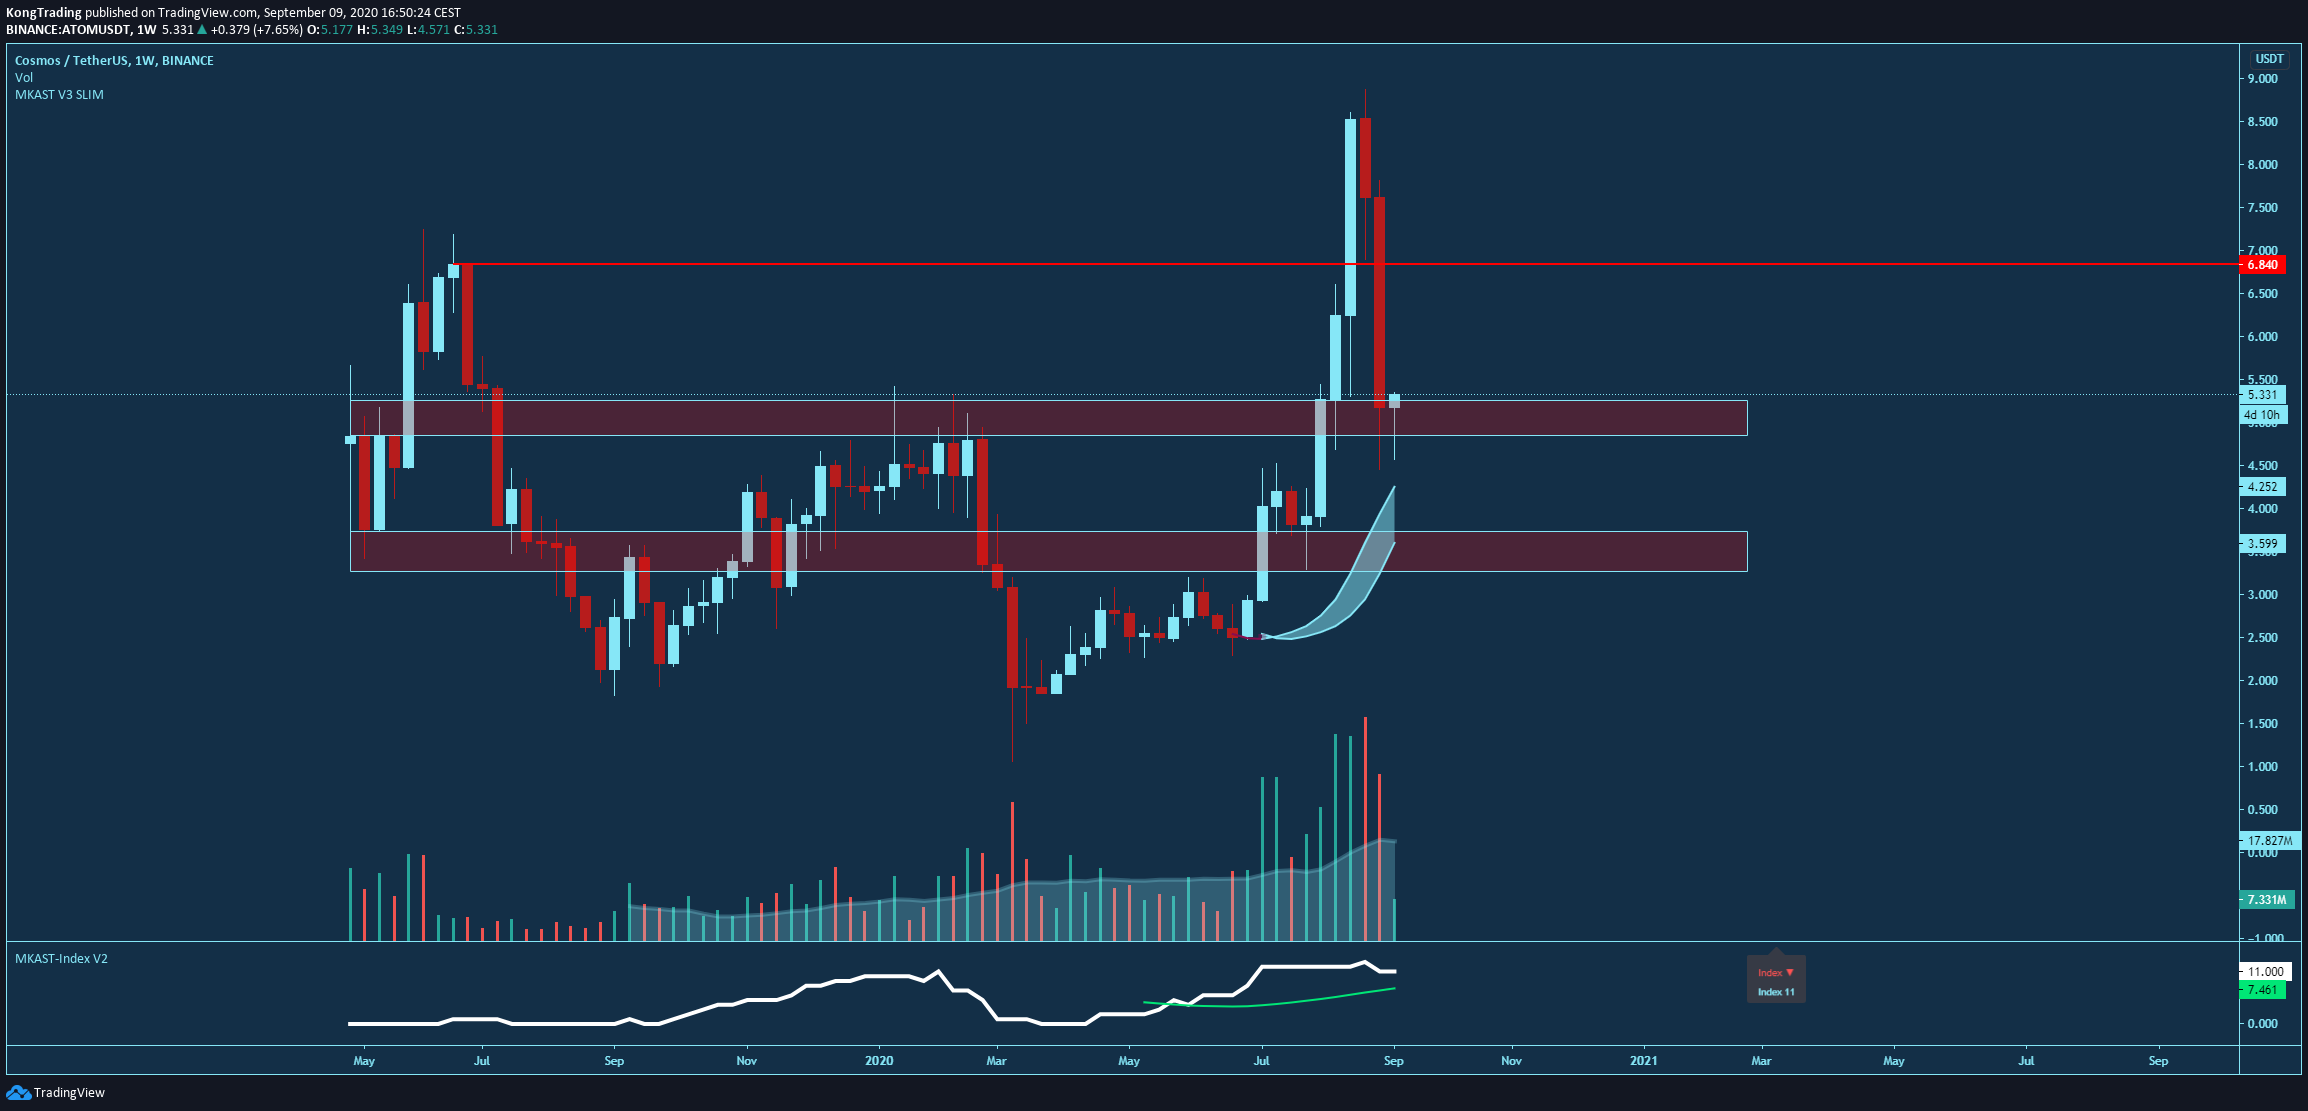 (Click the image for higher resolution)
ATOM started relatively moderately in the previous month compared to WAVES. Still, the movement's key components are very similar - a slow build-up towards the resistance and a strong breakthrough. Nevertheless, it would be crucial for ATOM to keep this earlier resistance as support; otherwise, it would go down for the area of interest of the previous and even lower support, which would already experience its second repetition.
The direct comparison between WAVES and ATOM is obvious for an experienced analyst. The setback at WAVES is technically more attractive, and even lower prices would be welcome. However, this is not the case with ATOM, and would not be so appealing. A large number of the same level or range tests are usually a sign that the level is weakening and will eventually fail.
Looking at the technical indicators in the same way as on WAVES, one can see the MKAST LenLen band entering the previous and lower-key support and resistance levels. This points to a possible re-testing of this range. Furthermore, the volume is more vital and higher on ATOM than on WAVES. This indicates a higher number of market participants willing to sell at recent prices. Nevertheless, the MAKST index is at the same level as the WAVES index at 11/15 points and still above its ALMA, which is a bullish sign.
DOT/USD 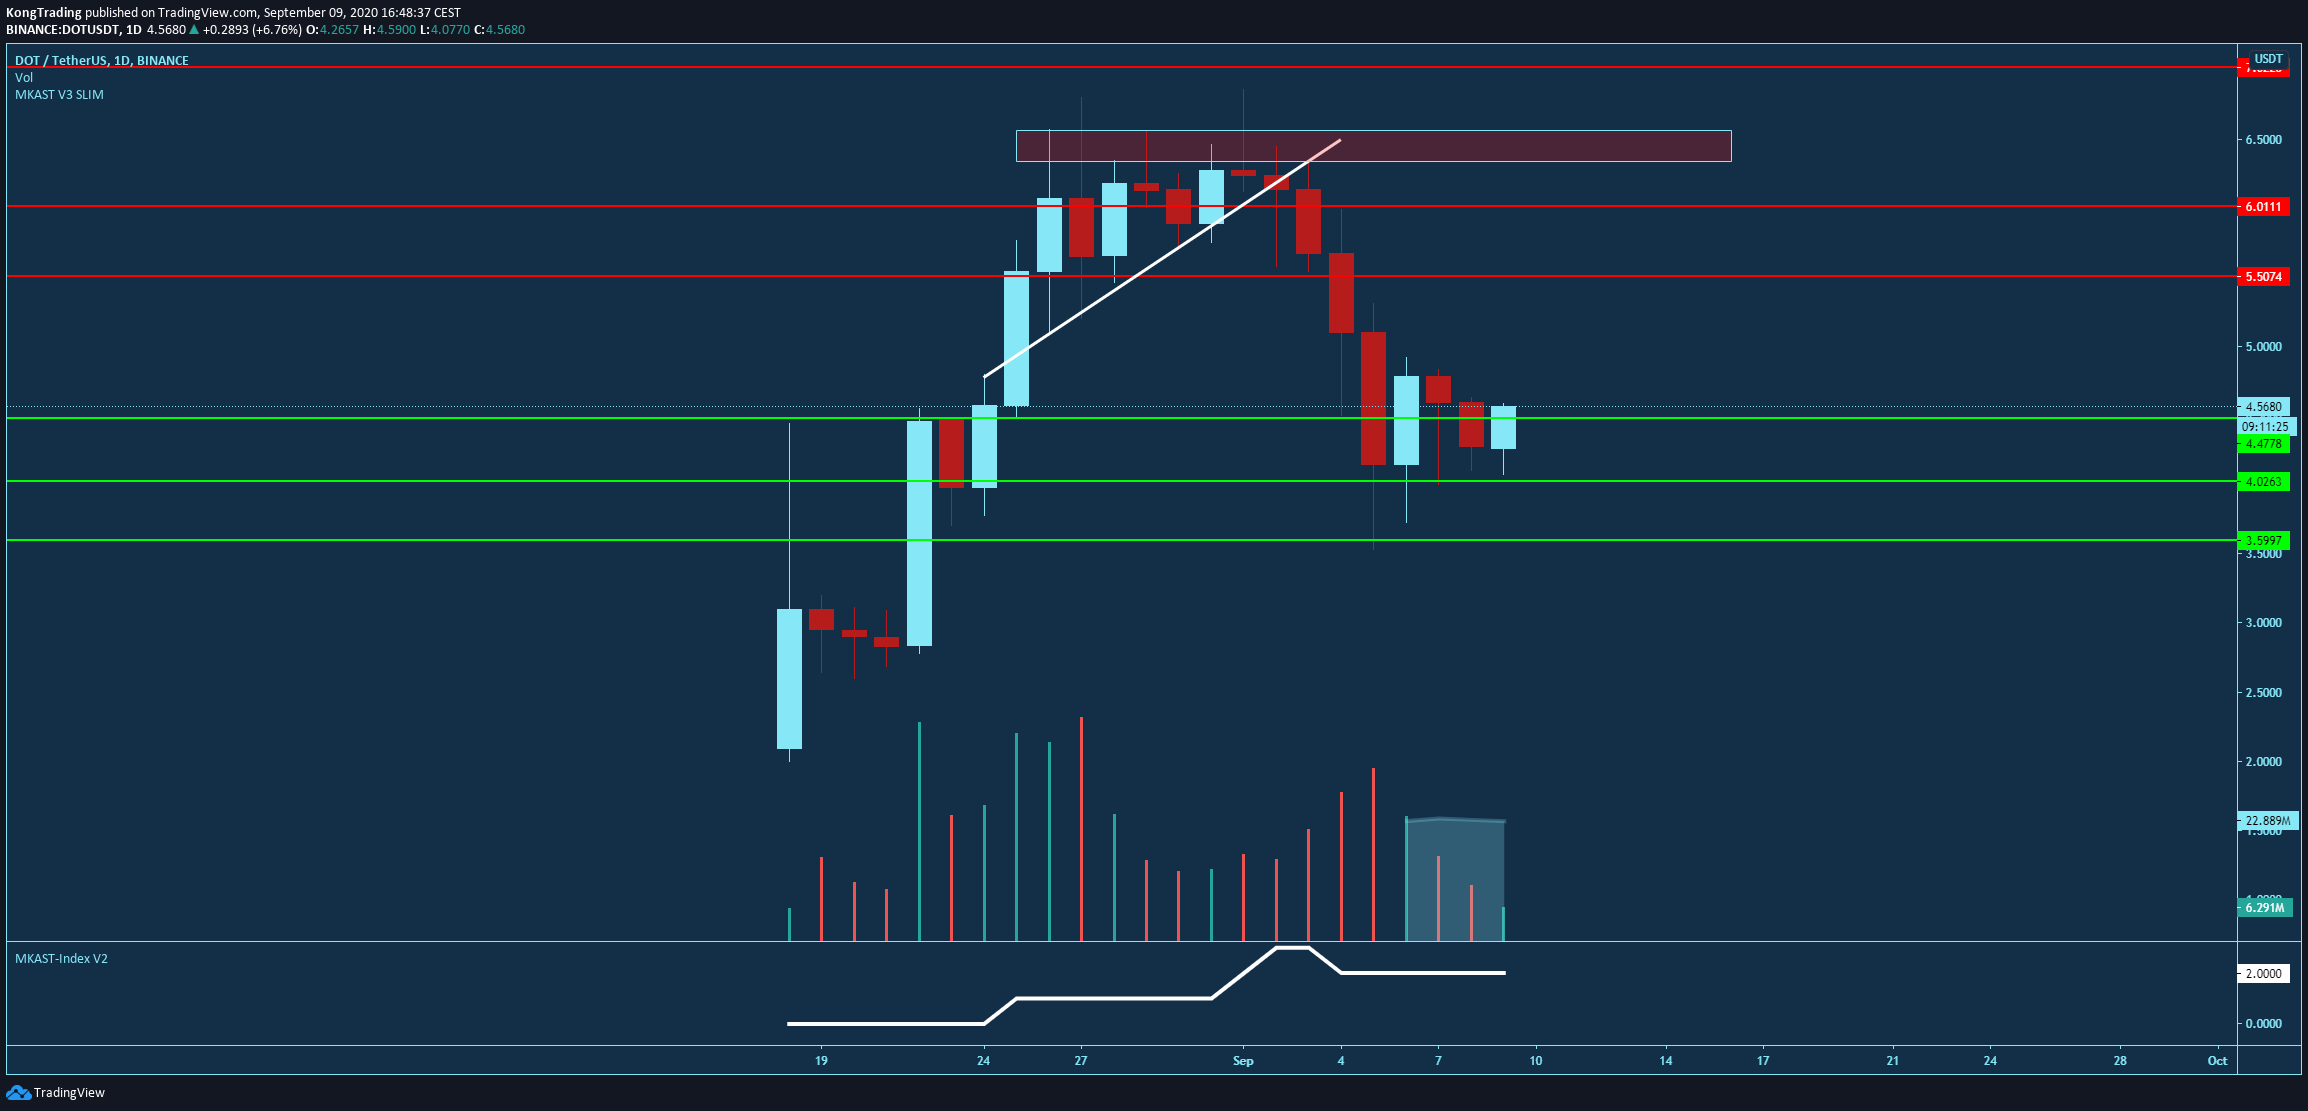
(Click the image for higher resolution)
POLKADOT is one of the completely new market participants and makes waves on the whole market. It started its journey with powerful and reinforcing movements that attracted much attention, causing even more movements. As usual, these movements have to be traced back at least a little bit to have a healthy correction to get to the top. The downside of the DOT is realistic and would even be appreciated if earlier consolidation levels were re-tested.
The direct comparison of the technical and pricing action status of all three assets is clear. While ATOM is still shaky, WAVES and DOT are the leading assets that are of most interest for a long and profitable future movement.
The technical indicators that have just been used for WAVES and ATOM provide little fulfilling information on DOT. Nevertheless, it is clear to see that the volume candles on the recent downward movements are significantly lower than the candles on the strong impulsive upward movements. Once again, we are dealing with a bullish re-trace and not a new downtrend.
Conclusion:
In summary, the comparison between the three direct competitors draws a clear line. The outlook for ATOM is shaky, uncertain, and possibly moderate rather than a full-blown uptrend. In contrast, the outlook for WAVES and DOT is surprisingly strong and has much potential to reach new all-time highs. However, while statistically, the DOT has a higher chance of stronger uptrends, it is precarious and is in a very early stage where a lot can go wrong, and the euphoric pumps can turn into euphoric dumps.
Therefore WAVES is the clear winner among the three assets. It has incredibly high upside potential, and the downside potential is calculated and moderate with high chances of a possible reversal and continuation upwards. The increased movement at the beginning of last month has paved the way to the upside, and should this simple support and resistance move work and not fail.
DISCLAIMER
The content is for informational purposes only. You should not construe any such information or other material as legal, tax, investment, financial, or other advice. Nothing contained on our Site constitutes a solicitation, recommendation, endorsement, or offer by Upblock or any third party service provider to buy or sell any cryptocurrencies (also called digital or virtual currencies, crypto assets, altcoins and so on). Trading and investing in cryptocurrencies (also called digital or virtual currencies, crypto assets, altcoins and so on) carries a high level of risk, and may not be suitable for all investors. Before deciding to trade cryptocurrencies, you should carefully consider your investment objectives, level of experience, and risk appetite. The possibility exists that you could sustain a loss of some or all of your initial investment and therefore you should not invest money that you cannot afford to lose. You should be aware of all the risks associated with cryptocurrency trading and seek advice from an independent financial advisor. ICO's, IEO's, STO's and any other form of offering will not guarantee a return on your investment. Since
Any opinions, news, research, analyses, prices, or additional information contained on this website is provided as general market commentary and does not constitute investment advice. Upblock will not accept liability for any loss or damage, including without limitation to, any loss of profit, which may arise directly or indirectly from use of or reliance on such information. All opinions expressed on this Site are owned by the respective writer and should never be considered as advice in any form.
